
Eligible for ABR Part III
Eclipse Scripting API (ESAPI)
The ability to connect, extract, and manipulate data within Eclipse utilizes the C# programming language as well as the Eclipse Scripting API, or ESAPI. Introduced to ESAPI during my residency, I found the possibilities to be endless as to what could be accomplished via scripting and the ability to reduce errors by ensuring the process from treatment planning to approval be as efficient as possible.
Rapidplan DVH Data Extraction

One of the most powerful planning tools in Eclipse is the ability to utilize RapidPlan to generate a plan automatically once contours have been created based on a previously created RapidPlan model specific to the treatment location. When starting out, the comparison of a RapidPlan model to the original human-generated plans requires extensive DVH data extraction.
Utilizing ESAPI, I created a script that takes in a CSV file containing plan names, Patient IDs, structure IDs, and DVH criteria, and will extract all the necessary information from each plan, both the original and the newly generated one from RapidPlan. The resulting CSV file is saved and can be easily utilized for comparison analysis between previously generated plans and the plan generate by RapidPlan.

IMRT Complexity Metrics
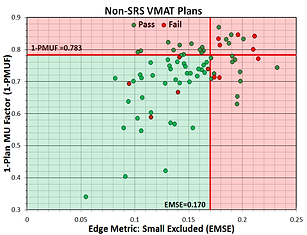
Many times, failures of IMRT QA measurements may not seem to have any rhyme or reason. Numerous complexity metrics have been created to attempt quantification of IMRT/VMAT plans in order to determine some value that can predict a failure during IMRT QA. In an attempt to do just that, I created a script that would calculate 10 different complexity metrics (plus 2 created by me) to see if any correlation exists between IMRT QA pass rate and one or more metrics.
The metrics themselves are based off of various aspects of a VMAT plan including leaf positions and movement, control point MU, aperture area, beam weight, and beam MU. Given the high modulation associated with SRS VMAT plans, 128 plans already measured were split into SRS and Non-SRS categories. In order to have a substantial amount of failures, Gamma Criteria was set to 2%/2mm with a passing threshold of 90%. Analysis between any 1 metric and pass rate or simply a Pass/Fail criteria turned out to not show any specific correlation. However, when two metrics were compared together, correlation could be determined, especially in SRS VMAT group of plans. Further study and more plans would be needed in order to determine if this predictability remains, but the ability to calculate these metrics immediately through ESAPI and compare them to values within a database makes this project interesting for future work.
SRS Conformity Metrics


When creating SRS plans for treatment of brain metastasis, apart from normal tissue constraints, various metrics can be calculated to determine the acceptability of any specific plan. These metrics vary in their calculation but most consider the dose coverage of the PTV, volume of the 100% and/or 50% isodose line, and volume of PTV covered by 100% of the prescription. When I started at Arizona Oncology, these acceptable ranges for these metrics were based on literature without indication of how the SRS plans created compared to each other over time. Additionally, the calculation of these metrics was a cumbersome and manual process.
Utilizing ESAPI, I was able to create a script that would calculate these metrics automatically and compare them to a database of metrics from previous plans. The script then displays the distribution of previous SRS Indices and exactly where on that distribution the current plan lies. This allows the user to see if their plan is within the normal range of indices calculated for plans already delivered. Additionally, the script populates the normal tissue constraints and indicates whether the current plan is within the constraint limits.
Future work will incorporate plots of PTV volume vs various indices to further indicate an appropriate range of index values based on the specific PTV volume being analyzed.

REname Field ID


Much of the manual processing involved in plan finalization can be prone to error simply because of the requirement for manual entry. Couple that with a specific naming convention that is required based on the type of plan while taking into account previous treatments, and entering the correct field ID that is visible for the therapists during treatment can involve extra time and can become complicated quickly.
Early on in my time at Arizona Oncology, I got together with other physicists to create a document indicating all naming conventions for Courses, Plans, and Fields. As the Field IDs are typically renamed as one of the last steps during plan finalization, I created a script that does the renaming automatically. Each field ID is to contain a letter prefix that is indicative of its order within the plan as well as its order within the courses of treatment. By simply having the user indicate the letter in which to start and the type of plan, the script will rename the fields according to our approved naming convention.


Microsoft Kinect v2

The Kinect v2 is a multi-sensor camera developed by Microsoft and originally intended for anatomical motion-tracking as part of the XBox One gaming console. However, it has expanded into a multi-use tool within the medical field. The Kinect sensor contains a 1080p color camera as well as a depth and IR sensor. The latter of which allows the camera to obtain depth information for objects within the camera's field of view.
Although similar cameras exist and are currently available from multiple vendors in the medical field, the Kinect v2 is available as an open-sourced product allowing anyone to develop code and create programs for the Kinect. The sensor hardware has been shown to be as accurate as more expensive products enabling the creation of robust programs for multiple clinical uses.
My Ph.D. research project has allowed me to work with the Kinect sensor to develop easy to use programs which have the potential for implementation in a clinical setting. Three programs have been created during this project with each one created to address a specific need within a radiation oncology clinic.

Patient Motion Management

The time between taking a CBCT immediately before treatment and the start of radiation treatment can be upwards of 5 minutes and requires the patient to remain in the same position for the CBCT image to be of any use for the treatment process. The patient must then remain in the same position during treatment requiring the patient remain still for some time. Ensuring that the patient remains in this position requires more than the standard CCTV camera installed in treatment vaults. This program allows the Kinect sensor to monitor patient motion before and during radiation therapy. The interface created displays the patient's entire body for gross anatomical motion tracking, or a specific region of interest as selected by the user.
For gross anatomical motion, the program tracks the 3D location of specific anatomical landmarks that are created and registered to the patient automatically by the Kinect. These positions are compared to an initial state and, if the distance moved exceeds a user set threshold, the system alerts the user as to which points have moved.
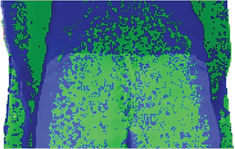
For tracking a smaller ROI, a simple green vs. red/blue color scheme is used to indicate areas of the body that have remained in the same initial position (green) or have moved outside a threshold distance either toward (red) or away (blue) from the Kinect. By calculating a percentage of area within the frame that has moved, the program can enable an automatic shutoff of the linac during treatment if the area of patient motion occurs above a threshold percentage.


Respiratory Motion Tracking

In order to take 4DCT images, respiratory motion is tracked and the images are gated by use of one of a number of different products currently available through various vendors. The difficulty of some of these products comes with finding an appropriate position on the body to get an accurate respiratory trace; the process can be cumbersome due to different breathing styles or trouble with patients breathing regularly. To add to this difficulty, these products typically require a device to be either placed on the patient or attached to them for the respiratory trace to be created.
I created a program that not only enables the Kinect to track and trace the same respiratory motion of currently available products but requires no physical contact with the patient. Additionally, the interface allows the user to manually select up to 12 points on the patient for this tracking process. Once complete, the program then selects the best position based on the largest max-min depth difference of each point during the trace.
This process was tested against both the Varian RPM Respiratory Gating system and the Anzai Gating system through various real-world breathing scenarios. The data produced by the Kinect was compared to each of the two products and results indicated similar, if not identical, capabilities and accuracy.


Patient Verification using Facial Recognition

Many radiation oncology clinics have adapted new technology to the patient verification process. Iris scanners, palm scanners, and RFID bracelets have all been implemented for this purpose. Working with this in mind, code was written that adapted and modified the currently available Kinect facial mapping libraries to act as a facial recognition tool. This program could be used as verification during the patient check-in process as well as immediately prior to radiation treatment.
The code created involves 3D mapping of the face, identification of 31 specific fiducial markers, and calculations of 465 3D vectors lengths between each of those markers. Those vector lengths identify a specific face and can be saved to file to create a reference data set. The program has the ability to make a comparison, in real-time, of the face currently being acquired to all faces within the reference set.
ROC curves were constructed to calculate threshold values for parameters to be used as similarity scores for a facial match. The similarity scores studied here were the mean and median of the difference in identical vector lengths when making a comparison. These parameters proved to be useful tools to determine a match when using this facial data and indicated both Sensitivity and Specificity of ~96% when utilizing a database of 39 faces, 115 different facial acquisions, and a total of 5299 facial comparisons.

